Setting fixed column widths in Power BI reports
While Power BI has many customization options for visuals, it lacks the seemingly basic capability to set exact column widths in tables and matrix visuals. In Excel, you can do this to create clean, uniform reports, while in Power BI you can only adjust column widths by dragging column headers. However, I’ll show you a workaround method for doing that in this post.
Step 1: Create a table visual
Open an any existing Power BI report which has a table visual, or generate one using the code below.
Sales =
ADDCOLUMNS(
    DATATABLE(
        "Product Name", STRING,
        "Net Price", CURRENCY,
        "Units Sold", DOUBLE,
        {
            { "iPhone 14", 799.99, 10 },
            { "iPhone 14 Pro Max", 999.99, 5 },
            { "iPhone Charger", 9.99, 50 }
        }
    ),
    "Net Sales", [Net Price] * [Units Sold]
)
Step 2: Disable auto-size width
By default, Power BI automatically sets column widths for tables and matrices. While this is suitable for most cases, you might want more consistent column widths. To deactivate auto-sizing, access the ‘Auto-size width’ property under ‘Column headers’ when selecting a table or matrix visual and switch it off.
Step 3: Adjust column widths manually
Disabling ‘Auto-size width’ signals Power BI to remember the fixed ‘columnWidth’ property. However, this only happens after you’ve manually altered the column widths following the initial disabling of ‘Auto-size width’. To do this, manually adjust the column widths in the user interface by dragging and dropping columns to the desired size. It’s advisable to make at least one column very large and one very small to distinguish these properties clearly in the .pbip’s report metadata.
Step 4: Save as .pbip type
Save your file in a new folder, and choose ‘Power BI project file (.pbip)’ as your type instead of the default ‘Power BI file (pbix)’ option. Name your file ‘Changing column widths’
Step 5: Modify the Report.json file
Navigate to the folder where you saved the files to, and open the ‘Changing column widths.Report’ folder. Within this folder, you will find a JSON file named ‘Report.’ Open this file using any code editor or Notepad.
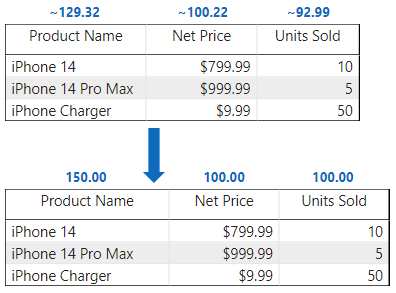
Within the ‘report.json’ file, find the ‘columnWidth’ section for your column. Within this section, you’ll find a floating-point number ending with ‘D,’ representing the column width. Replace it with your desired width. For example below, you can change ‘100.21686962908292D’ to ‘100D’ for the ‘Net Price’ column. Repeat this process for any other columns you wish to modify, and save the file.
"columnWidth\":[{\"properties\":{\"value\":{\"expr\":{\"Literal\":{\"Value\":\"100.21686962908292D\"}}}},\"selector\":{\"metadata\":\"Sum(Sales.Net Price)\"}}
Now we are finished and you can open the .pbip file to see the results.
Conclusion
This is a neat trick that highlights certain customizations that are currently hidden and not achievable in Power BI Desktop. I believe that Microsoft will likely introduce this functionality in the near future. In the meantime, I hope you find this tutorial useful.