What-if analysis with DAX
What-if analysis is a technique used to understand the potential impact on outcomes by altering the inputs in a model across various scenarios. Having worked on pricing projects at multiple companies, I’ve found that it’s a widely used practice.
Imagine you’re a business owner, and you’re considering offering a discount on your products. How much revenue will you make after applying this discount? Normally, you might turn to Excel to work out these numbers. But in this article, I’ll guide you on how to do it with DAX in Power BI.
Step 1: Create a sales table
Before we begin, let’s generate some data. Create a calculated table using the DAX code below.
Sales =
ADDCOLUMNS(
    DATATABLE(
        "Product Name", STRING,
        "Net Price", CURRENCY,
        "Units Sold", DOUBLE,
        {
            { "iPhone 14", 799.99, 10 },
            { "iPhone 14 Pro Max", 999.99, 5 },
            { "iPhone Charger", 9.99, 50 }
        }
    ),
    "Net Sales", [Net Price] * [Units Sold]
)
After the data is loaded, add all the fields to a table visual.
Step 2: Create a parameter table
Assume the data above represents revenue for last month, which did not have any discounts. Now imagine wanting to know the revenue each product would generate if we applied specific discount levels, such as 5% or 10% (assuming same number of units sold). To accomplish this, we need to create a parameter table.
Begin by making a basic parameter table for all the potential discount rates you wish to examine.
Discounts =
DATATABLE(
    "Discount Level", STRING,
    "Discount", DOUBLE,
    {
        { "0%", 0 },
        { "5%", 0.05 },
        { "10%", 0.1 }
    }
)
Step 3: Create a slicer for your parameters
After the table is created, add a slicer for the ‘Discount Level’ field, and choose ‘Single Select’ in the Slicer settings. You need ‘Single Select’ for the next step to work properly, since we need to model one scenario at a time.
Step 4: Create a measure for discounted sales
Now, we’ll use a DAX function called SELECTEDVALUE. This function picks the currently selected value in your slicer, meaning the discount rate chosen from your parameter table. Hence, as you select a discount rate, your sales figure automatically adjusts in your report according to the selected discount rate.
Discounted Sales =
VAR Discount = SELECTEDVALUE ( Discounts[Discount], 0 )
VAR NetSales = SUM(Sales[Net Sales])
RETURN NetSales * ( 1 - Discount )
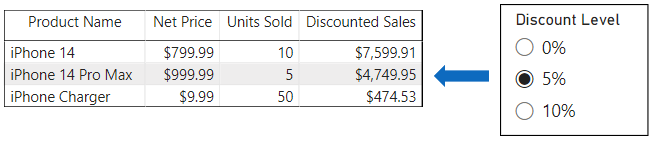
Finally, add this new measure to your table visual. You will be able to see the responsive result corresponding to the selection from your slicer. For example, in the screenshot below, the table is showing potential sales if a 5% discount was applied.
Conclusion
Now the data model is finished. There are many other examples we could’ve done, but I simply wanted to explain the concept. By using parameter tables, you can view and compare multiple scenarios on the fly, simply by selecting different parameters in the slicer. This is beneficial in pricing analytics as it enables you to perform what-if analysis effectively and make data-driven decisions. So, if you haven’t given parameter tables in Power BI a try, I highly recommend exploring this feature.